Update:
See my most recent letter from May 5th but also read this one below from April 13th that gets at my motivation.
Minneapolis Public Schools: Please don’t pass the Comprehensive District Design. It will be disastrous for the district.
May 05, 2020
_____________________
April 13, 2020 post:
I’m worried about the Comprehensive District Design for Minneapolis Public Schools
Thursday Superintendent Graff sent out an email announcing the final plan.
Or, instead of reading my analysis, here is the latest March 27th Star Tribune article which summarizes the plan. It notes the same things I do. https://m.startribune.com/minneapolis-public-schools-unveils-final-redistricting-proposal/569163152/
Foundational assumption: I want what is best for kids. I especially want to help kids who are not doing well and have been historically discriminated against.
I think people who are for the plan want this too. I’m against the plan because I think it won’t work.
From what I understand, the plan is likely to be passed by the school board.
Introduction:
I’m worried about the Minneapolis Public School’s Comprehensive District Design being bad for the city because it is going to make our southwest neighborhoods much more desirable in comparison to other areas of the city. I mean that sincerely even though I’m writing to southwest neighborhoods on Nextdoor. People will attend the community schools at Kenny and Armatage and Burroughs and Barton and Lake Harriet and Windom and Hale. Those schools will become even more desirable than they are now because they will have even better test scores in comparison to other parts of the city. Property values will really go up in southwest Minneapolis in comparison to other parts of the city. It will exacerbate economic and historic racial tensions. People in this area of the southwest will be very unlikely to attend magnet schools in other parts of the city. Minneapolis Public Schools projects all of the southwest schools will get whiter and wealthier: Burroughs, Barton, Windom, Armatage, Kenny, Anthony, Field, Justice Page, Southwest; and Lake Harriet Upper and Lower and Hale will largely stay the same, going up or down by less than 3%.
My analysis is below.
Andy
My latest on the Comprehensive District Design is below. I’ll share three sets of information that have now been presented by MPS. Then I will give my opinion.
(1)
First, it is good to look at which schools MPS says they are improving with the CDD. In summary, they plan to help 10 schools with above 86% of one race to slightly below 86% by offering new programming at those schools and closing programs elsewhere in the district to attract students to these options. There will still be 10 Racially Identifiable Schools with over 86% students of color, instead of 20.
The most important thing to note is that a Racially Identifiable School in a Minneapolis Public School is that 86% of students of color is the line where a school becomes RIS. https://equity.mpls.k12.mn.us/uploads/racially_identifiable_school_2019-20.pdf
They write, “MPS (Minneapolis Public Schools) projects that CDD (Comprehensive District Design) implementation will result in eight racially identifiable schools (RIS), including one high school and two culturally specific sites, and seven high poverty schools in the district.”
There will still be a projected 11 Racially Identifiable Schools (RIS), not 8. The source is https://www.cdd.mpls.k12.mn.us/school-info You have to slide the gray bar below over to the right until you get to the heading Projected RIS status and organize by that. Ordered by Projected Percent Students of Color. (This website and data was removed so here is the information downloaded in May 2020. CDD School By School Info – May 2020)
- Heritage 99.0%
- Anishinabe 96.60%
- HIA 94.90%
- Nellie Stone Johnson 94.50%
- Henry 91.20%
- Bryn Mawr 89.20%
- Olson 88.90%
- Bethune 87.70%
- Laney 87.30%
- Cityview 86.90%New one:
- Whittier 85.50%
_______
These two are also marked RIS in the MPS CDD database but that this is a mistake because the 86% only applies to students of color.
- Kenny 12.60%
- Burroughs 10.70%
The seven high poverty schools (according to projected % eligible for Free and Reduced Lunch (FRL)) also mentioned in the quote above are also RIS (Racially Identifiable Schools):
- Nellie Stone Johnson 90.40%
- Bethune 87.5%
- Anishinabe 87.4%
- HIA 86.5%
- Heritage 85.6%
- Cityview 85.0%
- Laney 84.2% (The line must be 84 or 83% eligible for FRL since they do not count Bryn Mawr as high poverty).
____
- Bryn Mawr 82.30%
____________
They also write: “MPS projects that the number of racially isolated schools will be reduced from 21 schools to 8 schools following CDD implementation.” I think the term they are looking for here is not “isolated” but “identified” and the correct number is 11, not 8.
MPS says in the second video that they project there will be “only 8 racially isolated schools reducing the racially isolated schools by 12.” Again, I think the correct statistic is 11 racially identifiable schools, reducing the racially identifiable schools by 10.
They help 10, not 12 to get from 86% of one race to less than that.
In other words, they take 20 RIS and remove 10 so there will be 10. And there is a new RIS Whittier.
These 10 schools move from Yes, RIS to No, RIS. They do so by switching programming in hopes of attracting a slightly different group of students.
- Andersen – Moves from K-8 to 6-8. Listed twice as both a community middle school and Spanish Dual Language Magnet middle school.
- Emerson – Spanish Dual Language Magnet hopes to draw more students because other Dual Language shut. 87.4% to 73.5%
- Folwell – K-8 Arts Magnet becomes K-5 Community School 87.8% to 81.8%
- Franklin – community school becomes STEAM Magnet 98.2% to 75.6%
- Green Central 91.3% to 78.2% – community school becomes Spanish Dual Language Magnet
- Hall 90.7% to 79.1% – PYP/IB becomes Steam Magnet
- Jefferson 97.5% to 70.7% – community school becomes Global Studies Magnet and has won the right to stay as a K-8
- Jenny Lind 91.9% to 83.6% – community school stays community school. (It is possible that the correct number for an RIS school is 83.1%, since MPS is 63.1% students of color and an RIS is 20% more than the district average. In that case, Jenny Lind would still be RIS).
- North High School (massive boundary shift)
- Sullivan 94.3% to 77.3%. – community school becomes STEAM Magnet and has won the right to stay as a K-8.
Whittier becomes RIS.
Subtract two:
Burroughs and Kenny move the other direction and are marked RIS in the MPS database.
(2)
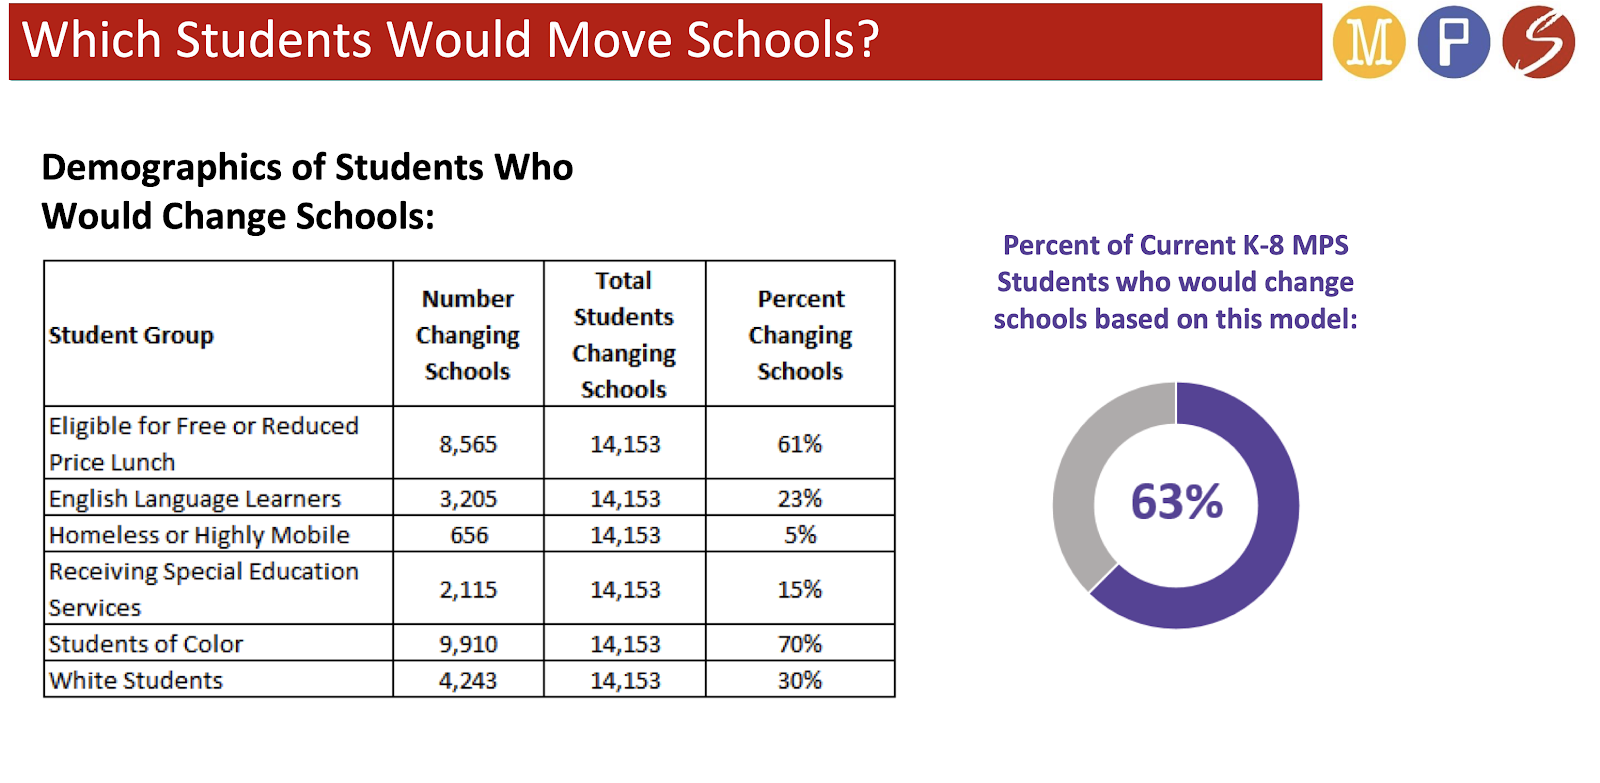
The second big piece of information from the latest report is that MPS said in December that 63% of K-8 would change schools and then in February introduced massive high school boundary changes that surely made that number go much higher.
Now they say “Every year approximately 21% of K-7 and 9-12 students transition schools. As part of the new CDD plan adoption, in the 2021-22 school year, an additional 14.7% of K-7 and 9-12 students are expected to transition. Note: 8th graders are excluded because almost all change schools every year.” That is a huge shift in how they are describing the change. I suspect that more than 63% will experience a huge shift in the classmates, staff, and teachers because their pathway (elementary school, middle, high school pathway) has changed. In other words, even if they do not shift schools, a large proportion of the classmates that they used to attend school with will attend another school.
(3)
The third piece of big information is that MPS is projecting that the CDD will result in $6.9 million in transportation savings. That is 1.1% of the district budget. It is that savings that is driving the CDD. MPS has a $19.6 million budget shortfall (the shortfall is 3.2% of the $619 million general fund budget).
Star Tribune: “Almost all of those recommendations were informed by a two-part transportation study conducted by Education Logistics Inc., a bus routing and tracking software company based in Montana. Since August 2019, Minneapolis Public Schools has been working with the company to carry out the studies that were released late last year and creating the models, costing the district $111,000 to date.” See “Minneapolis schools back in a big budget hole with a $19.6 million deficit” (Dec 11, 2019 Star Tribune).
_________________
The above are facts (as best I understand them).
My opinion is that trying to save money on busing has been what really dominated the final plan. They hired Education Logistics Inc. in August 2019 to study how to save money on transportation and also how to get as many Racially Identifiable Schools below 86% and to not close any schools. The computer programmer consultants came up with these maps as the most efficient configuration. They put magnets in a more centralized location to save transportation costs and switched some RIS schools to magnets and removed other magnets so there is more demand for the RIS magnets.
The result is reshuffling of all the schools in the whole district. Little consideration whatsoever has been given to the value of continuity or school culture. In other words, every school will need to start over with a new staff, new teachers, new students, and new programming. (The Minneapolis teachers union opposes the plan).
I see little educational theory here or research. This is a computer exercise in trying to save money on busing, moving ten schools from just over 86% of one race to just under that line, and closing zero schools. I think we should have low expectations of how well this will work. For the ten schools being shifted from Yes Racially Identifiable Schools to No RIS, there is some hope they will improve with new programming. However, the district will become as a whole sharply more racially divided. In the southwest part of the city, Burroughs, Barton, Windom, Kenny, Armatage, Anthony, Justice Page, and Southwest will all have less Students of Color and less Free and Reduced Lunch students. Busing has traditionally been used to foster integration but this plan seeks to save money on busing so that students go to school in their neighborhoods.
From a study published in the Harvard Business Review article entitled “Getting Reorgs Right” in 2016, the authors write that with reorganizations “more than 80% fail to deliver the hoped-for value in the time planned, and 10% cause real damage to the company. More important, they can be damned miserable experiences for employees. Research suggests that reorgs—and the uncertainty they provoke about the future—can cause greater stress and anxiety than layoffs, leading in about 60% of cases to noticeably reduced productivity.” I think this plan is likely to do more harm than good. I think more people will leave the district for neighboring districts or private schools and I think the disruption will be enormously costly financially and emotionally. The plan’s success depends on people in all parts of the city thinking the new programming options are better than their previous school experience. I do not know that turning previously ten RIS schools into magnets will necessarily do this.
Below I also past some other resources on the Comprehensive District Design:
______________
________________
Amy Michelle checks my work:
Finally getting to this – so Andy Rowell on point 1 – agree with what David Weingartner and Bridget Gernander have said above – the definition of Racially IDENTIFIABLE schools is 20% over the average of protected class for an age group. District-wide MPS was 62.28% on October official enrollment (and a bit lower – I think ~61%) for K-8. So the bar for RIS should have always been 82% not 86%. I asked several times why 86% was the bar used and never got an answer.
So the overall calculation of “improvement” in RIS is not accurate according to the definition – but also because the bar seemed to have shifted (claiming Sheridan, Anwatin, and Pillsbury as schools taken off the RIS list by the CDD when they were actually off already. (Circled in red)
Also Whittier and Lind are really ON the list post CDD with > 82.2%. (Circled in yellow)
Also – fundamental question – why has this metric been so critical to the whole plan? It’s central to every presentation of benefits.
So – Andy Rowell – yes, with the exception of North which has a massive boundary shift – all “gains” i.e reduction of RIS come from displacing a current school community with a different community d/t a change in programming or grade config.

______________
Akiva is inclined to support the plan because of the idea of a thriving community school is a good vision. However, Akiva thinks the key to creating thriving community schools is not adequately addressed in the plan. Akiva analyzes the Academic Plan and argues that the literacy curriculum is not good because it teaches cueing. I agree.
David Boehnke, a teacher on the north side, rightly says that “If community schools were a magic bullet to solve enrollment and teacher diversity, we’d see that in such schools in our district now.”
Beth Hawkins argues that Graff has done a poor job of listening to the people of Minneapolis.
_______________
April 24:
This panel discussion about the Comprehensive District Design (CDD) plan by Minneapolis Public School was excellent.
Facebook video:
The plan is to be voted on by the school board May 12th. This panel of people of color argue the plan is poorly thought out.
All five panelists were knowledgeable and articulate and accurate.
Some highlights of the session:
- Somali families are devastated that Barton would no longer be available to them. Approximately 50% of Barton are Somali.
- There is no one on the school board who is Hispanic. Spanish dual language programs have been moved out of Hispanic areas in south central Minneapolis.
- The costs of the CDD will be enormous since many buildings will need to be renovated for a different set of students. Also, there is a significant chance that there will be a massive loss of students from the district. The financial numbers that came out this week are vague and have sharply revised the transportation costs. The latest financial data from the district predicts big losses with the CDD.
- Research shows that K-8 are better for retaining students after 5th grade, which is the point when most leave the district.
- There should be an EDIA audit of the CDD by an outside evaluator. This is a district legal requirement. There was an EDIA for placement but that group felt rushed and did not feel the district incorporated their discussions. Will the CDD help equity or exacerbate it?
- Keep talking to school board members.
- 97% of feedback the district received after an invitation to give voicemails at an April school board meeting was negative.
- In sum, the CDD is enormously disruptive with no evidence it will improve student outcomes or improve equity or save money.
- Again, all of the discussion was worthwhile with very little repetition. The comments were also informative.
___________________
In the last meeting Board Meeting on April 28th, Member Ali was angry at Member Walser for speaking on behalf of Somalis. But on April 22nd, Zeinab Omar who is Somali asked other people who speak English to speak out against the loss of Barton and K-8 schools in the CDD because it is difficult for Somalis to speak out. She said: “The Somali parents would like English speakers to speak for them. They want their voice to be heard. However, because they can’t themselves, they are asking and pleading for everyone else who speaks the language of English to speak. They are looking for allies in this problem that we are foreseeing . . . In the last meeting I had with the Somali parents, they said that ‘We have no voice. Please find people to speak for us since we don’t speak the language.’” 1:44:26. And see approximately: 1:19:00 to 1:27:00
https://m.facebook.com/story.php?story_fbid=231768131375339&id=106503757423938 I think some of the misunderstanding may have to do with that.
___________________
Summary of CDD on a Twitter thread:
https://threadreaderapp.com/thread/1253217589351899136.html?refreshed=yes
The principles behind the Comprehensive District Design are to
1. Save busing costs.
2. Reduce the number of schools that are over 86% students of color to under that line.
3. Close no schools.
However, there are some logical problems as well.
Or dig into the data.
cdd.mpls.k12.mn.us/school-info,
mpls.k12.mn.us/cdd_documents
Then talk to your school board members.
First tweet of thread:
https://twitter.com/AndyRowell/status/1253217589351899136?s=19
______________
Julie writes
For those who are interested in research, the Stanford Educational Project has some very interesting research and interactive data. We all know there is a large black/white (and a significant Hispanic/White) achievement gap in our district and wish it weren’t so. But, Stanford’s data makes me question even more why a plan as radical as the CDD is warranted. Above all, we need to mitigate the effects of poverty, and I see nowhere in the plan that proposes how to do this.
“Average student test scores are influenced by opportunities to learn at home, in neighborhoods, in child-care, preschool, and after-school programs, from peers and friends, and in schools. Because of all these influences, average test scores are not a good way to assess how much children learn in schools. But they are a good way to assess the average set of educational opportunities available to children in a community. Where average scores are low, students have fewer opportunities to learn. Schools are better evaluated using learning rates, which measure how much students’ scores improve while they are in school…
The trend (or change) in average student test scores from one year to the next indicates whether educational opportunities are improving or declining in a community. Where the trend is positive, students’ opportunities to learn are improving. Opportunities may improve over time because of changes in school quality or because of changes in family resources, home environments, early childhood experiences, and/or community resources…
Learning rates measure how much students’ scores improve each year while they are in school. This is a better way to assess what children learn in schools than average test scores, which are heavily influenced by factors outside of school. To understand the distinction, think of a hospital: We wouldn’t assess a hospital based on the health of its patients; rather, we’d judge it on how much the health of patients improves as a result of their time in the hospital. Similarly, we shouldn’t evaluate a school based on the average scores of its students, but rather by how much their scores improve while in school.”
Play around with the website (there are lots of different things to explore), and draw your own conclusions. https://edopportunity.org/explorer/#/map/mn/districts/avg/ses/pn/10.5/44.97/-93.24/2721240,44.97,-93.26
According to this data, MPS socioeconomic status is about average.
MPS test scores (a less important measure according to these authors):
Average scores are -0.61 grade levels lower than districts with similar socioeconomic status.
Students score 0.94 grade levels below U.S. average.
MPS trend in test scores (a positive trend indicates opportunities are improving):
Students’ test scores increased an average of 0.03 grade levels each year from 2009-2016.
“Minneapolis Public School District shows improving educational opportunity. Average scores have improved by 0.02 grade levels more than districts with similar socioeconomic status.”
Learning rates (the factor the authors say is most important):
Students learn 5% more each grade than the U.S. average…
Learning rates are 7% higher than districts with similar socioeconomic status…
Black/white test scores differ by 4.62 grade levels each year.
White/Hispanic test scores differ by 4.21 grade levels each year.
Poor/non-poor test scores differ by 4.2 grade levels each year.
Black/white learning rates differ by 24% each year.
White/Hispanic students learning rates differ by 6% each year.
Poor/non poor learning rates differ by 19% each year.
Black/white test score trends differ by 0.12 grade levels each year.
White/Hispanic students test score trends differ by 0.05 grade levels each year.
Poor/non-poor test score trends differ by 0.14 grade levels each year.
As appalling as some of this data is, the district is not showing a downward trend in either learning rates or test score trends. A situation that might warrant a change of this magnitude. Addressing poverty, vastly improving the pre-school experience for these communities, and offering wrap-around community services and resources is what is needed to change the status-quo. The CDD is hoping that by just moving bodies around to different schools, which will result in some schools being a few percentage points lower in students of color, is going to magically correct things. This just isn’t so.
____________
Reader comment:
People still ignore/forget the $24M cut after 3 years of losing 400 students each year, as anticipated by CDD (which many believe is a lowball prediction).
Each student = $10k in state funding.
100 students = $1M
Year 1) 400 withdraw = $4M loss.
Year 2) Additional 400 withdraw = $4M.
But add in the previous withdrawal of 400 students in yr 1 also not enrolled = another $4M.
That’s $12M after 2 years.
Year 3) ANOTHER 400 withdraw = $4M.
But add in the 400 withdrawn since Yr 1 ($4M + $4M + $4M = $12 M).
Then add the 400 withdrawn since Yr 2 ($4M + $4M = $8M).
That’s $24M over 3 years!
_______________
Shorter version of post above:
I worry that the Comprehensive District Design from Minneapolis Public Schools will do more harm than good. The Star Tribune March 27th article entitled “Minneapolis Public Schools’ final redistricting proposal packed with changes” gives a good overview of the final version of the Comprehensive District Design for Minneapolis Public Schools.
Here are some facts I want Minneapolis residents to be aware of:
- With the Comprehensive District Design, every school in the southwest part of the city will have less students of color and less students eligible for free and reduced lunch. This includes Burroughs, Barton, Windom, Armatage, Kenny, Anthony, Field, Justice Page, Southwest; and Lake Harriet Upper and Lower and Hale will largely stay the same, increasing or decreasing by less than 3% on those metrics.
- Minneapolis Public Schools is selling the plan by saying: “MPS projects that the number of racially identifiable schools (RIS) will be reduced from 21 schools to 8 schools following CDD implementation” but there will actually only be a net improvement of seven schools, not thirteen. Their own records at https://www.cdd.mpls.k12.mn.us/school-info only show ten schools (Jefferson, Emerson, North, Franklin, Sullivan, Green Central, Andersen, Hall, Folwell, Jenny Lind) not thirteen moving from above to below the 86% students of color threshold. The first eight of those which they project will change the most would become magnet schools. Magnet schools around the rest of the district would be eliminated so that students who really want a magnet school would need to attend one at a previously RIS school. Meanwhile, Whittier will move the other direction and become an RIS as they project it will be 85.5% students of color though it is not included in their total because they do not round up to 86% in their projection. And two schools will become more than 86% white (Burroughs and Kenny). So, the net change in schools with more than 86% students of color or white is only really seven schools, not 13. Moreover, there will still be ten RIS schools (Heritage, Anishinabe, HIA, Nellie Stone Johnson, Henry, Bryn Mawr, Olson, Bethune, Laney Cityview) with more than 86% students of color.
- All agree that the CDD is massively disruptive. Superintendent Ed Graff says in the introductory video that “in order to disrupt the status quo, we cannot tinker around the edges.” MPS said in December that 63% of students K-8 would change schools and then in February introduced massive high school boundary changes that surely make that number go much higher. Now they say “21% of K-8 students currently transition schools and the CDD will shift 14.7% more students one time.” That is a huge shift in how they are describing the change. All agree that the plan is a massive shakeup to every school in the district with their grade levels, magnet curriculum changing, and number of students changing. Therefore, almost every school in the district will be starting over in terms of teachers, staff, students, and culture.
- The core of the plan is to move magnets to a more central location in the city, which is projected to save 1.1% of the district budget, $6.9 million, in transportation savings. Meanwhile, MPS has a $19.6 million budget shortfall (the shortfall is 3.2% of the $619 million general fund budget). “Almost all of those recommendations were informed by a two-part transportation study conducted by Education Logistics Inc., a bus routing and tracking software company based in Montana. Since August 2019, Minneapolis Public Schools has been working with the company to carry out the studies that were released late last year and creating the models, costing the district $111,000 to date” (Star Tribune, Dec 11, 2019 article “Minneapolis schools back in a big budget hole with a $19.6 million deficit”).
In summary, I worry that the southwest schools will become more white and wealthy, while eight racially identifiable schools have their curriculum switched to try to attract more students, while every school in the district must start over, in order to save 1% in busing costs. There are too many negative consequences here and not enough positive ones.
____________
Note also enrollment changes. I saw this photo below but I wanted to check it so I made my own Excel document. The image actually describes capacity declines.

_____________
My earlier March 12, 2020 letter.
Dear Mr. Moore,
A. How many students will change schools? In November, it was announced that 63% of K-8 students would change schools.
At the meeting on Feb 24th the high school boundaries were revealed, which shifted many more students. How many students will change now? There is a massive incalculable human cost to shifting boundaries and having every school in the district effectively have to start over in terms of its staff, teacher, and student culture. How many schools are being massively changed by this move? All of them?
Yes, some people are speaking out “late” in the process. In November 2019 and then late February 2020, the implications of the priorities of: “neighborhood schools” and “save money on busing” and “no closing schools” were spelled out. It is one thing to have those principles and another to destroy everything that does not fit those goals. You had better really, really believe in those priorities because all the continuity every school in the district has built up will be turned upside down.
B. Will this plan make the district less racially integrated? The racial diversity of all the K-5 schools in Zone 1 will change 9% or less (except Waite Park which becomes 11% whiter). In other words, the racial composition will not change very much at these schools.

In the Southwest part of the city, Burroughs, Barton, Windom, Kenny, Armatage, Anthony, Justice Page, and Southwest will all have less Students of Color and less Free and Reduced Lunch students so this does not seem to be about more integration across the district. Busing has traditionally been used to foster integration but this plan seeks to save money on busing so that students go to school in their neighborhoods. Students from the north side will not be able to bus to the southwest like they used to for Barton, Armatage, and Windom. Is this segregation a good thing? Why not keep any healthy open and magnet schools as they are and just fix the busing to them? I’m afraid the quest to emphasize neighborhood schools will segregate the city worse than it is currently.
C. Is the main strategy to fill empty schools rather than close them? Is the reasoning: “If more students are districted to attend the empty schools, then those schools will have more funding and thus more equity in programming?” In other words, is this primarily a matter of having the computer generate new zones to fill empty schools? If so, okay. But we should not have high hopes that this will improve the education but will hopefully funnel more students toward that school.
The high school boundaries seem designed to help North High School get out of its pattern of being under enrolled like it is currently at 17% full. In 2009, it was proposed that North High would be closed but instead it was invested in heavily. Now the vast expansion of boundaries for North High School is the strategy. This may bring more students and thus more funding to the school but is hardly an education strategy. How many students will open enroll in St. Louis Park High School, or Hopkins, or go to a private school at Benilde or Breck or Blake? Few students who live near North High School have wanted to go there despite a superb principal from 2012-2019. Is the CDD the vision of the current principal? No, it is not.
D. For how many schools will the CDD improve academic outcomes?
According to the November information, before the magnet information was released, a few K-8 schools were predicted to improve dramatically. None are in north Minneapolis. Sheridan is in northeast.
-
Jefferson (97 to 28% Students of Color). 87 to 21% FRL. Projected difference in reading proficiency by 51%.(It is near Lake of the Isles. It will become a middle school Magnet).
-
Folwell (88 to 52% Students of Color) 83 to 44% FRL. Projected difference in reading proficiency by 38%. (It will no longer be a magnet).
-
Sheridan (214 to 344 students). (It will become a Duel Immersion Magnet). Projected difference in reading proficiency by 30%.
-
Bryn Mawr (233 to 463 students). Projected difference in reading proficiency by 22%.
-
Barton. Projected difference in reading proficiency by 21%.
-
Anwatin. (82 to 61% Students of Color). Projected difference in reading proficiency by 17%.
-
Bancroft. Projected difference in reading proficiency by 17%.
I wish there were more that would be vastly improved. 14 will become less than 10% better and 16 will get worse.
____________
Responding to this:
“Under the plan, the number of racially isolated schools goes from 21 to eight schools.”
Fair point! Fine. Don’t count HIA and Anishinabe because they are culturally specific sites!